 R: the bare essentials
What you need to know before logging in to DST
You do not need to learn R from scratch. This phase gives you the minimum you need in order not to feel lost when you see your first line of code in Phase 6. Data structures and basic commands for exploratory analysis come in Phases 7 and 11 — they make no sense until you have data to look at.
Download R and RStudio
R and RStudio are already installed on the DST server — you do not need to install them now. But if you want to practise locally before logging in for the first time:
- R: cran.r-project.org — download the latest version for your operating system
- RStudio: posit.co/download/rstudio-desktop — free desktop version
Learning resources
If you want to learn R, epidemiology or statistics, you will find a curated list of courses, books and references in Phase 15 — Learning resources.
Quick pick: Start with DDEA Introductory Course if you are completely new to R, or The Epidemiologist R Handbook if you know a bit of R and want to go straight to health science applications.
RStudio for the first time
RStudio is divided into four panels:
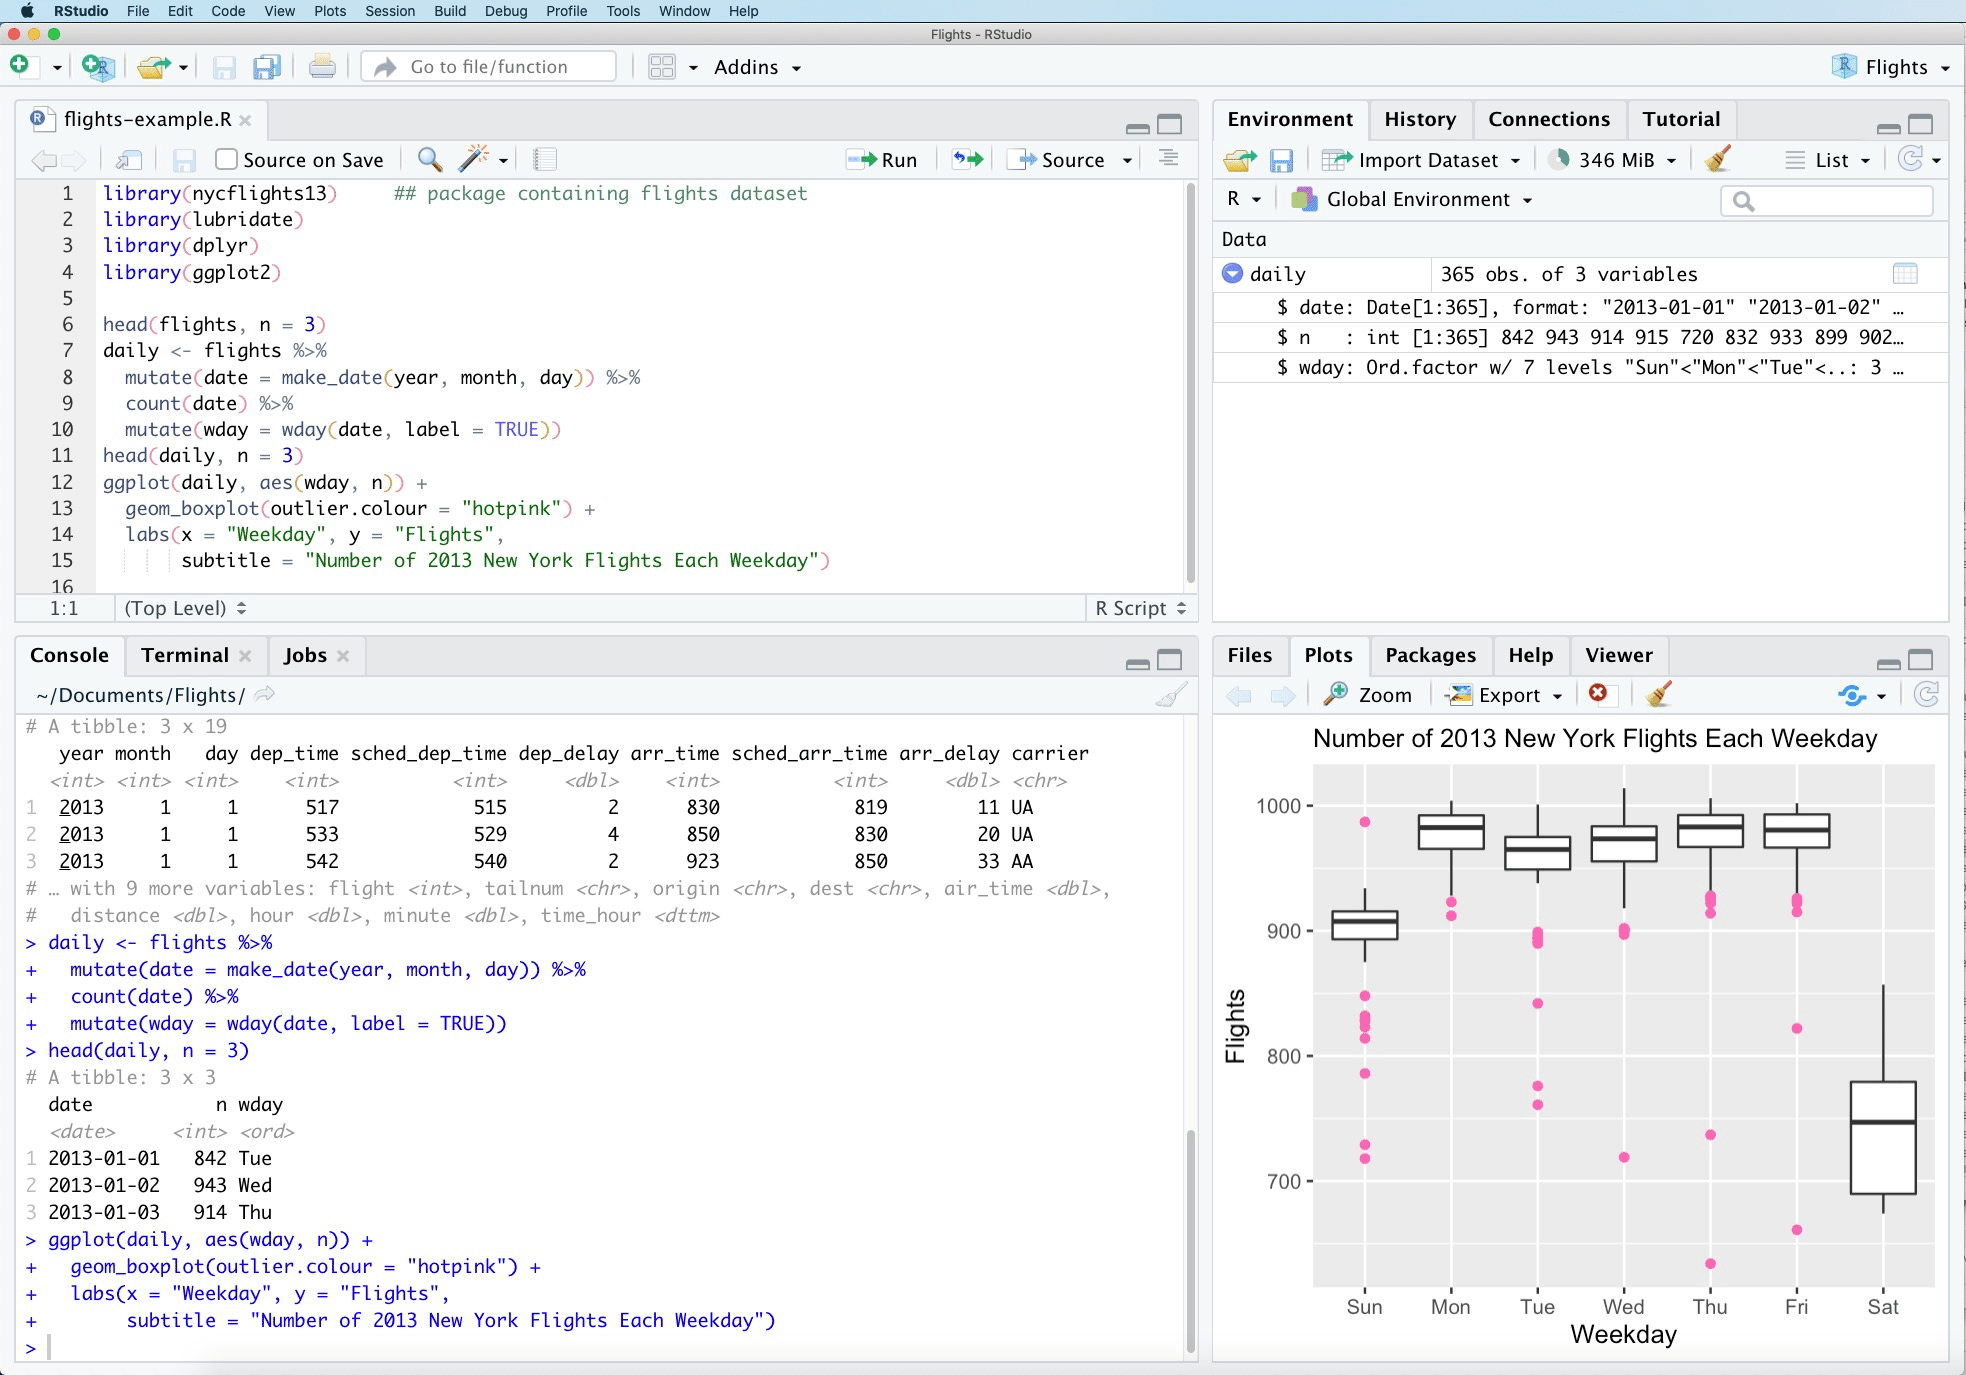
Source: Wikipedia / RStudio, CC BY-SA 4.0
Top left — Script editor
This is where you write and save your code. You can have multiple scripts open at once and switch between them using the tabs at the top of the panel. Remember to save changes regularly — Ctrl+S (Windows) / CMD+S (Mac).
Top right — Environment / History / Connections
- Environment: shows all objects you have created in the current R session — data frames, vectors, lists. Functions from packages (e.g.
filter()from dplyr) are not shown here; only what you have created yourself. - History: a log of all commands you have run in the console.
- Connections: used for database connections and version control systems such as GitHub. GitHub is an online system for storing and sharing code — but the DST server has no internet access, so you cannot synchronise code directly from there. You do not need to learn GitHub to work on DST.
Bottom left — Console
Code is executed here and output and error messages are shown here. You can type commands directly in the console — but they are not saved. All work you want to keep must be in a script.
Bottom right — Files / Plots / Packages / Help
- Files: a file browser for your folders and files on the server.
- Plots: graphs you create are shown here — even before they are saved.
- Packages: list of all installed packages. A tick next to a package means it is loaded with
library()and ready to use. - Help: help documentation. Opens automatically when you type
?functionnamein the console — e.g.?filteropens the help forfilter().
If a panel disappears: go to View → Panes → Show All Panes in the menu bar at the top. You can also click the icon with four squares in the menu bar.
Run code: place the cursor on a line and press Ctrl+Enter.
Open a script, write one line, run it
File → New File → R Script
Write these three lines and run them one at a time with Ctrl+Enter:
x <- 5        # assign the value 5 to the variable x
x             # type the variable name to see the contents
x * 2         # use the variable in a calculation
You have now written, run and used your first line of R code.
What is an object?
x <- 5 creates an object. The arrow <- means “store what is on the right under the name on the left”. From now on x stands for the value 5 — until you overwrite it yourself. The pattern is always the same:
name <- somethingYou name something so you can reuse it later without writing it out again. Almost everything in R is an object: a single number, an entire table, a model. When you fetch a register with collect(), for example, you typically store it in an object so you can keep working with it:
bef_data <- bef %>% collect() # store the fetched table in the object bef_dataThe objects you create appear in the Environment panel in the top right of RStudio.
What is a function? A package? What does library() do?
A function is a command that performs an action. filter(data, age > 50) is a function. sum(c(1, 2, 3)) is a function. You recognise functions by their parentheses.
What is inside the parentheses? The parentheses are always there — but they are not always filled. It depends on whether the function needs input to know what to do:
filter(age > 50)— requires you to specify the condition; otherwise it does not know what to filter onopen_dataset("E:/workdata/...")— requires the path; otherwise it does not know what to opencollect()— requires nothing; it already knows what to fetch, because it is the pipe that has sent data forward to itungroup()— requires nothing; it simply removes the grouping from whatever has been piped through
Rule of thumb: empty parentheses mean the function acts on what has been passed forward via the pipe, without needing anything extra from you.
A package is a collection of functions written by others that you can load. R comes with base functions, but most of what we use is in packages such as dplyr and arrow.
library() loads a package so its functions are available in your session.
install.packages("dplyr")   # install the package once (or after a server reset)
library(dplyr)               # load the package at the start of each session
You will see library(dplyr) at the top of almost every script.
6 functions and symbols you’ll meet throughout the guide
You will see these in almost every extraction. You do not need to understand them in detail now — just recognise them.
A symbol you will see everywhere is %>% (the pipe). It passes the result from one line forward as input to the next. df %>% filter(age > 50) means: “take df, and pass it to filter()”. This makes it possible to chain steps together and read code from top to bottom.
| Function | What it does | Example |
|---|---|---|
filter() |
Keep rows that meet a condition | df %>% filter(age > 50) |
select() |
Choose which columns to keep | df %>% select(pnr, age, sex) |
collect() |
Fetch parquet data into R’s memory | register %>% filter(...) %>% collect() |
mutate() |
Create a new column or modify an existing one | df %>% mutate(age_cat = age > 65) |
left_join() |
Link two datasets — keep all rows from the left | cohort %>% left_join(bef, by = "pnr") |
%>% |
The pipe — passes the result to the next function | df %>% filter(age > 50) %>% select(pnr) |
The pipe %>% is explained in detail in Phase 15 — Functions: overview, and collect() in Phase 5 — Extracting data step by step.
When you get stuck
Follow this order. AI is at the bottom for a good reason.
| # | Where | When |
|---|---|---|
| 1 | Colleague or supervisor | Ask first — they know your data and workflow |
| 2 | Search for the error message including Error: |
|
| 3 | Stack Overflow | The world’s largest collection of coding questions and answers |
| 4 | Zheers R Coding Café | r-coding-cafe.zheer.dk — register-data specific |
| 5 | Official package documentation | Search the package name + “documentation” |
| 6 | AI (Claude, ChatGPT) | Good for code problems, but easy to believe wrong answers — use only when you understand the answer |
Avoid AI as your first stop if you are new. AI can generate plausible-sounding code that does not work — or works but gives wrong results. Use it as a supplement to your own understanding, not as a substitute.
How to use AI most effectively for R code
AI is good at explaining error messages and suggesting solutions — but you need to give it enough context, and you must verify the answer yourself.
Give AI this:
- The exact error message (including
Error:and line number if there is one) - The failing code — as little as possible, but enough to reproduce the error
- What you expected vs. what happened
- Which packages you are using (e.g. “dplyr and arrow on DST”)
Example of a good AI question: > “I get Error: Column 'pnr' not found when I run this code with dplyr and arrow on DST. I am using load_database() from dstDataPrep. What is wrong?” > r > bef <- load_database("bef") > bef %>% filter(pnr == "001") # error here >
Ask for explanation, not just a fix: Write “explain what is wrong and why” rather than just “fix it”. If you only get the code corrected without understanding why, the same error will appear again next time.
Ask AI to ask questions before answering: Write “ask me questions before you answer if you need information”. AI often guesses at context it does not have — this produces better answers if it asks about e.g. your package version, register type or what you actually want to achieve.
Always verify the answer: Code examples from AI are starting points — not guarantees. Check that column names, function names and logic match your data with names(), class() and head().
How to ask a good help question (minimal reproducible example)
A good help question is minimal (smallest code that shows the error), complete and reproducible.
Bad: “My code fails, what is wrong?” (no code, no error message)
Good: > “I get the error Error: object 'pnr' not found — what is missing?” > > r > library(dplyr) > df <- data.frame(PNR = 1:5, age = 20:24) > df %>% filter(pnr > 3) # error here > > > Expected: rows where PNR > 3. Actual: error that ‘pnr’ is not found.
The error: the column is called PNR, the code asks for pnr. R is case-sensitive.
Keyboard shortcuts in RStudio
| Mac | Windows | Action |
|---|---|---|
Option + - |
Alt + - |
Insert the assignment operator <- |
| CMD + SHIFT + M | CTRL + SHIFT + M | Insert pipe (%>% or \|>) |
| CMD + Return | CTRL + Enter | Run line/selection and move to next |
| Option + Return | Alt + Enter | Run line/selection and stay on same line |
| CMD + S | CTRL + S | Save |
| CMD + SHIFT + R | CTRL + SHIFT + R | Insert section heading in script |
| CMD + Z | CTRL + Z | Undo |
| CMD + SHIFT + Z | CTRL + SHIFT + Z | Redo |
| CMD + A | CTRL + A | Select all |
| CMD + SHIFT + A | CTRL + SHIFT + A | Reformat/re-indent code |
| Option + ←/→ | CTRL + ←/→ | Jump one word at a time |
| Option + SHIFT + ←/→ | CTRL + SHIFT + ←/→ | Select word by word |
| F1 | F1 | Open help for the function at the cursor |
F1 — quick function help: Place your cursor inside a function name (e.g. inside filter) and press F1 — the help page opens directly in RStudio’s Help panel with description, arguments and examples.
Pipe shortcut: choose which pipe is inserted. Tools → Global Options → Code → Use native pipe operator controls whether CTRL/CMD+SHIFT+M inserts |> (native, newer R) or %>% (magrittr, the dplyr convention).
Good code and reproducibility
The most important thing in register-based research is that your results can be reproduced — by a reviewer, a colleague, or yourself six months from now. This requires a certain discipline in how you organise and write your code: numbered scripts, run top to bottom, meaningful names, comment the why, and write functions for repeated tasks.
You do not need all of that now — you will meet it when you start writing your own analysis code. The full walkthrough is in Phase 12 — Write good analysis code.
Next steps
You now have the concepts you need to understand the code. Phase 3 is your first login to the DST server.